Why do most enterprise AI investments fail to show measurable ROI? The most consistent finding across 2026 research is that failed AI ROI is a measurement problem, not a technology problem. 95% of enterprise generative AI pilots fail to deliver measurable P&L impact according to MIT Project NANDA research – yet 78% of organisations now use AI in at least one business function (McKinsey 2024 State of AI), yet only 29% of executives say they can reliably measure AI ROI (McKinsey March 2026). The gap between adoption and value is not explained by poor AI systems. It is explained by three measurement failures: no baseline established before deployment (so improvement cannot be proven), activity metrics tracked instead of outcome metrics (so usage data is mistaken for value), and AI measured in isolation from the workflow changes that make it valuable (so the data infrastructure investment is invisible in the ROI calculation).
What is a good AI ROI and how long does it take to achieve? IBM research found companies realise an average return of $3.50 for every $1 invested in AI – but this average masks wide variation. The 12% of organisations achieving both cost reduction and revenue growth from AI are distinguished not by better models or larger budgets but by measurement discipline: they baseline before deployment, track outcomes rather than activity, and redesign workflows to capture the productivity gains AI generates. Time to ROI varies significantly by use case: structured automation (invoice processing, document extraction) typically shows positive ROI within the first quarter; productivity copilots typically show ROI within 3-6 months; complex agentic deployments typically show 6-18 month payback. Deloitte’s 2025 research found typical AI ROI takes 2-4 years at programme scale, with only 6% of organisations seeing payback under a year.
There is a specific conversation happening in boardrooms across the world in the second half of 2026. It begins with: “We have been investing in AI for two years now. What has it actually delivered?”
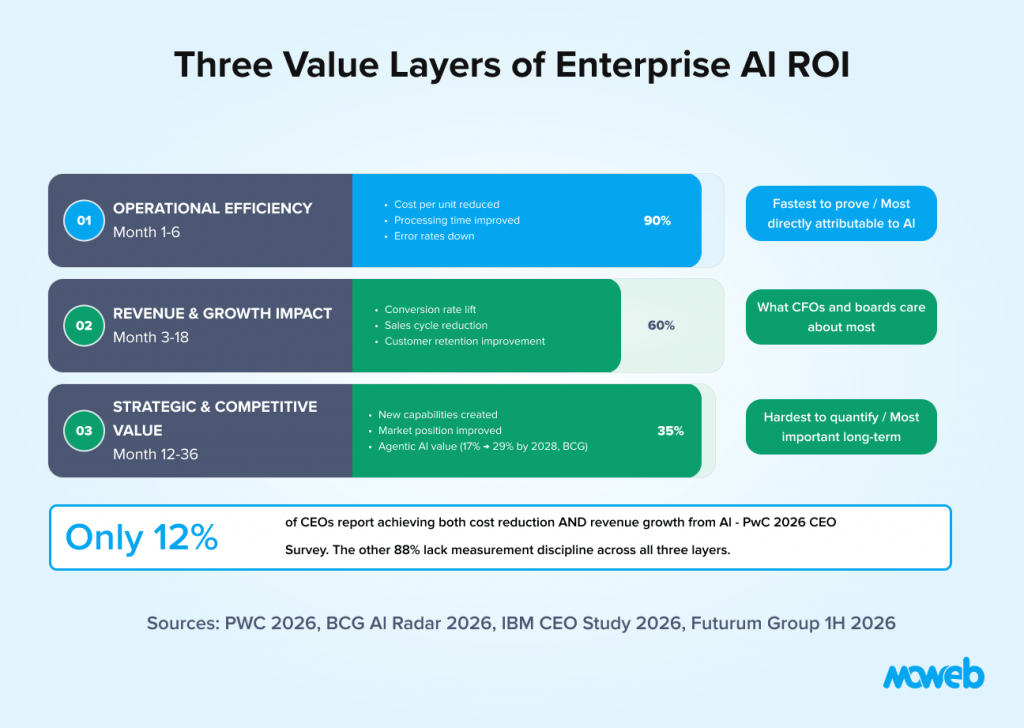
For 56% of CEOs, the honest answer to that question is that there is nothing they can prove. PwC’s 2026 CEO Survey found that 56% of CEOs report neither increased revenue nor decreased costs from AI in the last 12 months. Only 12% report achieving both. This is not primarily a statement about AI systems failing to perform. It is a statement about organisations failing to measure. McKinsey’s March 2026 Global AI Survey of 1,847 C-suite executives confirms the measurement gap persists: only 29% say they can reliably measure AI ROI, despite 79% reporting productivity gains.
The MIT Project NANDA study found 95% of enterprise generative AI pilots deliver zero measurable P&L impact. IBM research found that companies that measure correctly realise an average return of $3.50 for every $1 invested in AI. The performance gap between these two groups is not explained by access to better models or larger budgets. It is explained by whether the organisation established a measurement framework before deployment, not after results.
The era of AI for AI’s sake is over. Every major 2026 enterprise survey confirms the same shift: from pilot justification to value accountability. The Futurum Group’s 2026 survey found that direct financial impact as the primary AI ROI metric nearly doubled to 21.7%, while productivity gains fell from 23.8% to 18% as the headline measure. Boards want revenue and cost impact. “Users trained” and “prompts generated” will not sustain an AI budget.
This guide provides the framework for measuring AI ROI correctly: the three value layers that matter to boards, the baseline and instrumentation discipline that makes value visible, use-case-specific metrics by function, the five measurement mistakes that kill AI programmes, and a board-ready reporting structure that connects AI investment to the outcomes executives care about.
Why AI ROI Is Harder to Measure Than Other Technology Investments
Before introducing the framework, it is worth understanding why AI ROI is genuinely harder to measure than a CRM implementation or a cloud migration – because the measurement challenges are structural, not incidental.
Benefits are often indirect. When an AI system helps a lawyer review contracts 40% faster, the benefit is productivity – not a direct cost reduction on the P&L. Unless the organisation tracks time saved and connects it to either reduced headcount requirement, higher output volume, or increased revenue per employee, the value remains invisible. Most AI productivity gains are indirect in this way.
Multiple causal factors operate simultaneously. An AI deployment rarely happens in isolation. It coincides with team restructuring, process redesign, seasonal variation, and market changes. Isolating AI’s specific contribution requires either controlled testing (A/B comparison between AI-enabled and non-AI-enabled teams or markets) or matched-market analysis. Without a controlled design, attribution is speculative.
The measurement infrastructure must be built alongside the AI system. Pilot costs are easy to track. Ongoing operational value requires instrumentation that most AI deployments do not include from day one: logging of tasks completed, time saved per interaction, quality metrics, and connection to the business KPI the AI was designed to improve. Adding measurement retroactively after deployment is always harder than designing it in. MIT Sloan research found production cost overruns average 380% compared to pilot projections. The measurement infrastructure that is absent at pilot stage becomes an expensive retrofit in production.
AI value compounds over time in ways that short measurement windows miss. An AI customer service agent that is mediocre in month one is typically significantly better in month six as it accumulates production data and the team learns to use it effectively. A measurement window that cuts off at month three may correctly record low ROI for a deployment that would show strong ROI by month twelve. The payback model must match the expected value trajectory of the specific use case.Agentic AI deployments where autonomous agents take multi-step actions across enterprise systems represent a specific and growing ROI category: BCG research shows agentic AI accounted for 17% of total AI value in 2025 and is expected to reach 29% by 2028, but their payback timelines run 18-36 months and require dedicated measurement frameworks that traditional copilot metrics do not cover.
Understanding these structural challenges is what separates a measurement framework that generates useful information from one that generates defensible-looking numbers that do not reflect reality. For realistic cost expectations at each stage of the AI investment journey, see our guide to what an AI proof of concept costs in 2026 (https://www.moweb.com/blog/ai-proof-of-concept-cost-2026).
The Three Value Layers of Enterprise AI
The most common measurement mistake is treating AI ROI as a single number rather than a layered set of value categories that operate on different timescales and require different measurement approaches.
Enterprise AI value comes in three distinct layers, each important to boards for different reasons.
Layer 1: Operational Efficiency (Months 1-6)
Operational efficiency is the fastest and most directly measurable layer of AI value. It covers: time saved on specific tasks, cost per unit of output reduced, error rates reduced, processing speed increased, and headcount-to-output ratio improved.
This layer is where most AI ROI conversations start and where most measurement frameworks end. That is a mistake – but it is the right place to start, because Layer 1 value is the foundation that establishes credibility for subsequent investment in Layers 2 and 3.
Layer 1 examples with specific metrics:
- Invoice processing AI: processing cost per invoice (baseline vs. post-AI), exception rate (percentage requiring human review), processing time per invoice
- Customer service AI: average handling time per interaction, cost per resolved interaction, first-contact resolution rate, escalation rate to human agents
- Document intelligence: extraction accuracy (field-level, measured against ground truth), processing volume per day, cost per document processed
- Code assistance: lines of code reviewed per developer hour, defect rate per release, time from requirements to deployment
The critical discipline: all of these metrics must be measured before deployment to establish the baseline against which post-deployment performance is compared. An AI that reduces invoice processing time from 3 minutes to 45 seconds generates 75% time reduction – but only if the 3-minute baseline was measured and recorded before the AI was deployed. For the specific use cases by function that generate the clearest Layer 1 ROI, see our guide to the best first AI use case for finance, ops, and support teams (https://www.moweb.com/blog/best-first-ai-use-case-finance-ops-support-teams).
Layer 2: Revenue and Growth Impact (Months 3-18)
Layer 2 captures AI’s contribution to revenue generation, customer value, and growth acceleration. It is harder to measure than Layer 1 because the causal link between AI capability and revenue outcome requires more analytical work – but it is what boards and CFOs ultimately care about most.
Layer 2 examples with measurement approaches:
- AI personalisation in ecommerce: conversion rate for AI-recommended products vs. non-recommended (A/B test), average order value for sessions with AI engagement vs. without, repeat purchase rate for AI-engaged customers
- AI sales intelligence: opportunity win rate for AI-assisted deals vs. non-assisted, sales cycle length (AI-assisted vs. baseline), revenue per sales rep (pre-AI vs. post-AI)
- AI-assisted customer success: customer retention rate, NPS for AI-enhanced interactions vs. standard interactions, expansion revenue in accounts with AI-assisted success management
- AI demand forecasting: stockout frequency and associated lost revenue (baseline vs. post-AI), markdown volume for excess inventory (baseline vs. post-AI), working capital efficiency
Layer 3: Strategic and Competitive Value (12-36 Months)
Layer 3 is the hardest to quantify but the most important for sustained AI investment. It captures the capabilities that AI creates, which determine long-term competitive position: faster product development cycles, new service offerings that were not possible before, the ability to serve customer segments previously underserved, and the talent and data advantages that compound over time.
Jensen Huang’s often-cited comment that “demanding immediate ROI from AI is like forcing a child to make a business plan” – while frustrating to CFOs – reflects a genuine reality about Layer 3 value. Some AI investments create capabilities that generate significant returns over 3-5 years that would not be captured in a 12-month payback calculation.
The practical approach to Layer 3 measurement is capability tracking rather than financial tracking: documenting specific new capabilities the organisation now has that it did not have before, the customer outcomes those capabilities enable, and the competitive situations where they make a difference. This is not soft reporting – it is a structured capability inventory that the board reviews alongside the Layer 1 and 2 financial metrics.
The BIO Framework: Baselines, Instrumentation, Outcomes
The most practical operational measurement framework in 2026 is BIO: Baselines, Instrumentation, Outcomes. It is straightforward in principle and frequently neglected in practice.
Baselines
A baseline is the quantitative measurement of the current state of the process the AI is intended to improve, established before the AI is deployed.
The requirement is specific: you must have numbers, not descriptions. “Our sales process is slow” is a description. “Our average sales cycle is 47 days, 23% of opportunities stall at the proposal stage, and our win rate is 31%” is a baseline. The baseline is the foundation of every ROI claim the organisation will make. Without it, every number produced after AI deployment is an assertion, not a proof.
Establishing a baseline requires three to six weeks of deliberate measurement before an AI deployment begins. For most organisations, this measurement exercise surfaces surprising gaps in their current performance data that are valuable regardless of the AI programme.
For the 30% of enterprises where clean baseline data does not currently exist because operational systems do not capture it, the data infrastructure investment needed to generate baseline data is also the first investment in the data foundation that the AI system will need to function. Baselines and AI readiness are the same investment. A structured AI readiness assessment (https://www.moweb.com/blog/ai-readiness-assessment-checklist-mid-sized-enterprises) completed before deployment includes the data quality and infrastructure evaluation that generating reliable baselines depends on.
Instrumentation
Instrumentation is the logging and monitoring infrastructure that tracks AI system activity and its connection to business outcomes during production operations.
Minimum instrumentation for every AI deployment:
- Every AI system interaction is logged with a timestamp, user identifier (anonymised where required by data protection), task type, and completion status
- Quality metrics sampled regularly: accuracy of AI outputs on a representative sample, measured against defined ground truth or human reviewer assessment
- User adoption metrics: percentage of eligible users actively using the AI system, frequency of use, task types used for
- Business outcome metrics connected to the AI: the specific KPIs the AI was deployed to improve, tracked on the same cadence as the AI interaction data
The most common instrumentation failure is logging AI activity but not connecting it to business outcomes. Knowing that the AI processed 10,000 documents last month is interesting. Knowing that those 10,000 processed documents reduced the compliance team’s processing backlog from 6 weeks to 2 weeks, and that the 4-week reduction has a $240,000 resource cost equivalent, is ROI.
Outcomes
Outcomes measurement is the periodic calculation of AI impact on the business metrics established in the baseline, using the data generated by the instrumentation layer.
Outcome reviews should happen monthly at the operational level (team leads and AI operations managers reviewing the performance metrics), quarterly at the programme level (AI programme lead reviewing portfolio performance against targets), and annually at the board level (presenting the full three-layer value picture against the programme investment).
Each outcome review should answer three questions: what is the AI delivering relative to the baseline (Layer 1), what is the business impact in revenue and customer terms (Layer 2), and what strategic capabilities has the programme created (Layer 3)? The answers to all three questions, with supporting data from the instrumentation layer, form the board-ready AI ROI narrative.
Use-Case-Specific Metrics by Function
Different AI use cases require different metric frameworks. The following covers the primary enterprise functions and the metrics that matter for each.
Finance AI metrics: Invoice processing cost per unit (target: 60-75% reduction), exception rate (target: below 8% for standard invoice types), month-end close duration (baseline vs. post-AI), GL coding error rate (baseline vs. post-AI), FTE equivalents released for higher-value work. For the specific AI applications in financial services that generate the highest documented ROI, see our guide to AI in fintech: fraud detection, underwriting, and compliance automation (https://www.moweb.com/blog/ai-fintech-fraud-detection-underwriting-compliance-automation).
Operations AI metrics: Information search time per employee per week (measured via time-tracking sampling), process compliance rate on AI-documented procedures, new employee time-to-competency (baseline vs. post-AI with knowledge assistant), ticket escalation rate for AI-handled queries.
Customer support AI metrics: Average handling time per interaction (target: 25-40% reduction for Copilot, 60-70% reduction for autonomous resolution), cost per resolved interaction, first-contact resolution rate, customer satisfaction score for AI-handled vs. human-handled interactions, escalation rate to human agents. The specific metrics applicable depend on which capability level is deployed. See our guide to the difference between AI chatbot, Copilot, and AI agent (https://www.moweb.com/blog/ai-chatbot-vs-copilot-vs-ai-agent-difference-enterprise) for how the metrics differ by autonomy level.
Sales AI metrics: Opportunity win rate (AI-assisted vs. non-assisted), average sales cycle length, revenue per sales rep (pre-AI vs. post-AI), lead-to-opportunity conversion rate, and time from lead assignment to first meaningful contact.
Legal and compliance AI metrics: Contract review time per document type (target: 40-50% reduction), clause extraction accuracy, compliance exception detection rate (comparing AI vs. manual review on a sample), time to regulatory change response, and audit preparation time.
Engineering and development AI metrics: Code review time per pull request, defect escape rate per release, feature delivery time from requirements to deployment, and developer time on routine vs. creative tasks.
For every metric, the measurement approach is identical: establish the baseline before deployment, instrument the workflow to generate data during deployment, calculate the delta, and translate it to financial impact using loaded cost rates for the affected employee time or process cost.
The Five Measurement Mistakes That Kill AI Programmes
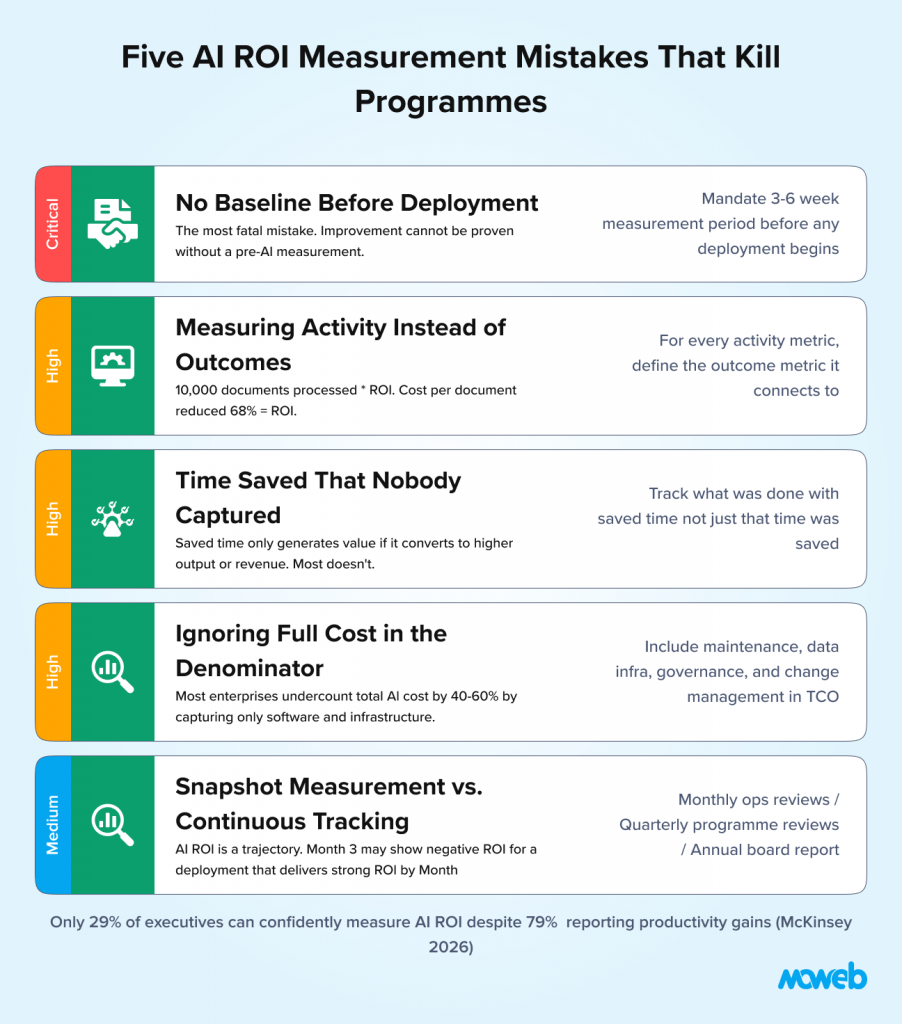
These are the five most consistent measurement failures that lead to AI programme defunding – not because the AI failed, but because the value was not demonstrated.
Mistake 1: No baseline before deployment. The single most common and most fatal measurement mistake. Without a pre-AI baseline, you cannot prove improvement. “The AI saved 30 minutes per invoice” requires knowing that each invoice previously took 45 minutes. If no one measured the 45 minutes before the AI was deployed, the claim is unverifiable. Fix: mandate a 3-6 week measurement period before any AI deployment begins. Use this time to collect the process data that becomes the baseline and the AI’s training signal simultaneously.
Mistake 2: Measuring activity instead of outcomes. “The AI handled 15,000 queries last month.” “The AI generated 3,000 documents.” These are activity metrics. They measure what the AI did, not what it changed. Fix: for every activity metric, define the outcome metric it connects to. 15,000 queries handled = X% reduction in customer service cost per interaction compared to baseline. 3,000 documents generated = Y% reduction in lawyer time per document type, worth $Z in billable hour equivalent.
Mistake 3: Overestimating time savings without capturing them. Telling the board that the AI saves 30 minutes per task, when employees fill that time with low-value activities rather than higher-output work, is an ROI claim that evaporates under scrutiny. AI saves time. Time savings only generate financial value if they convert to higher output, reduced headcount requirement, or redeployment to higher-value work. Fix: track not only time saved but what was done with it. This is a management discipline question as much as a measurement question.
Mistake 4: Ignoring the full cost in the denominator. AI ROI = (Total Return – Total Cost) / Total Cost. Most organisations calculate the numerator carefully and undercount the denominator. Direct costs (model licences, API consumption, infrastructure) are easy to track. Indirect costs that are frequently missed: engineering time for maintenance and edge case handling, data quality remediation work, ongoing governance and monitoring overhead, change management and training investment, and the cost of the data infrastructure the AI runs on. Fix: Establish a fully-loaded AI total cost of ownership model before deployment. Maintain it throughout the programme. A CFO who discovers post-hoc that actual costs were 40% higher than reported will defund the programme even if the returns are genuine.
Mistake 5: One-time measurement instead of continuous tracking. AI ROI is not a quarterly snapshot. AI systems drift, degrade, and evolve. Usage patterns change. The workflow context changes. A system that showed strong ROI in month three may be performing significantly differently by month nine. Fix: implement monthly operational tracking, quarterly programme-level reviews, and annual board-level reporting. Show the trajectory, not just a point-in-time number. Trajectory data that shows consistent improvement is more persuasive to a board than a single strong number with no context.
Building a Board-Ready AI ROI Report
The board does not want 46 KPIs. It wants a defensible link between AI investment and the outcomes it cares about: financial performance, operational efficiency, risk reduction, and competitive position.
A board-ready AI ROI report has five components. For the organisational structure that owns the AI portfolio measurement and reporting function, see our guide to how to build an AI Center of Excellence (https://www.moweb.com/blog/how-to-build-ai-center-of-excellence-structure-roles-roadmap).
Component 1: Portfolio summary. Total AI investment (year-to-date, cumulative), number of AI systems in production, number in development, and number retired. This establishes the scale and maturity of the programme.
Component 2: Layer 1 financial returns. The quantified operational efficiency improvements across the AI portfolio: total cost saved, total processing volume enabled at lower cost, and headcount efficiency gains. Expressed in dollars (or local currency), connected to the specific AI systems that generated them, and measured against documented baselines.
Component 3: Layer 2 business impact. Revenue influenced by AI systems, customer metrics improved, growth enablement. For each metric, the pre-AI baseline and the post-AI measurement, with the attribution methodology (A/B test, matched market, time-series comparison).
Component 4: Layer 3 strategic capabilities. New capabilities the programme has created, competitive situations where they have made a difference, and the investment logic for continuing to build them. This section requires narrative alongside data.
Component 5: Investment outlook. What the programme will cost over the next 12 months, what returns are projected at each layer, and what the specific milestones are that will determine whether each projection is on track. Boards fund future investment on the credibility of the measurement framework that tracked past investment.
Frequently Asked Questions About AI ROI Measurement
How do I measure AI ROI if I cannot run a controlled A/B test? A/B testing is the gold standard, but is not always feasible. Three alternative approaches are reliable: matched-market analysis (comparing performance in two historically similar departments, regions, or customer segments where only one uses AI during the measurement period), time-series comparison with statistical controls for seasonal and market effects (comparing the same metric before and after AI deployment while controlling for known external factors), and structured estimation using time-tracking data (measuring a sample of employees’ time allocation before and after AI deployment and calculating the aggregate impact). Each approach has limitations; document them alongside the findings.
What is a realistic AI ROI timeline for a first enterprise deployment? For structured automation use cases (invoice processing, document extraction, contract review): positive ROI typically visible within the first quarter, full payback within 6-12 months. For productivity copilot use cases (drafting, research, summarisation): ROI visible within 3-6 months as adoption matures, full payback typically 6-18 months. For complex agentic deployments: 6-18 months to positive ROI, 18-36 months to full payback at programme scale. Deloitte’s research found that only 6% of organisations see AI payback under a year at programme scale – individual use cases reach payback much faster.
What AI ROI metrics does the board actually care about? Boards care about metrics that connect to the numbers they track for the business overall: revenue growth, cost reduction, margin improvement, risk reduction, and competitive position. The Futurum Group’s 2026 research found that direct financial impact (revenue growth plus profitability) nearly doubled as the primary board-level AI metric. Translate every AI metric into one of these business terms. “The AI processed 10,000 documents” becomes “document processing cost reduced by 68%, generating $340,000 in annualised savings against a $120,000 programme cost.” That is a board-ready metric; the former is not.
How do I calculate the fully-loaded cost of an AI deployment? Fully-loaded AI cost includes: model licensing and API consumption (direct), cloud infrastructure (direct), engineering time for initial development (direct), engineering time for ongoing maintenance and updates (often missed), data quality remediation work (often missed), governance and compliance documentation (often missed), training and change management (often missed), and the allocated cost of the data infrastructure the AI depends on (rarely captured). Many organisations undercount total AI cost by 40-60% by capturing only direct software and infrastructure costs. The denominator of the ROI calculation must be fully-loaded to be defensible.
What is the difference between AI productivity metrics and AI ROI metrics? Productivity metrics measure what the AI does: interactions handled, documents processed, tasks completed, and time saved. ROI metrics measure what the AI changed in business performance: cost per unit reduced, revenue influenced, error rate improved, and decision quality enhanced. Productivity metrics are inputs to the ROI calculation, not the calculation itself. An AI that handles 10,000 interactions and generates no change in cost per interaction or customer outcome has high productivity metrics and zero ROI. The measurement framework must connect productivity to outcomes.
How should we measure ROI on AI infrastructure investments like data engineering? AI infrastructure – data pipelines, data warehouses, feature stores, governance frameworks – is the hardest AI investment to measure in isolation because its value is realised through the AI applications it enables. The correct approach is to allocate infrastructure cost across the AI use cases that depend on it, using a methodology that reflects each use case’s data consumption. A data lakehouse that enables three AI applications should have its cost allocated across all three in the ROI calculation for each, rather than appearing as a standalone cost centre with no clear return.
Conclusion: Measurement Discipline Is What Separates the 12% From the 88%
The research on AI ROI in 2026 is unambiguous about what separates the 12% of organisations achieving both cost reduction and revenue growth from the 88% who cannot prove either. It is not model quality, vendor selection, or budget size. It is a measurement discipline: establishing baselines before deployment, instrumenting workflows to generate continuous outcome data, and connecting AI activity to the business metrics boards care about.
The organisations that will sustain AI investment through 2027 and beyond are not those with the most impressive AI capabilities. They are those with the most credible measurement frameworks – ones that can show a board, in defensible financial terms, what each AI deployment has returned against what it cost.
Measurement discipline is also a prerequisite for learning. An organisation that measures consistently knows which AI investments are generating value and which are not, and can reallocate accordingly. An organisation that does not measure is flying blind – funding pilots that sound impressive and cutting programmes that are actually working because the value was never made visible.
Moweb’s AI Strategy and Consulting practice includes AI ROI framework design as a standard component of every engagement – establishing the baseline measurement, designing the instrumentation, and defining the board-reporting structure before development begins. Talk to us about building your AI measurement framework.
Found this post insightful? Don’t forget to share it with your network!


